Posts

Showing posts with the label Park Island price graph

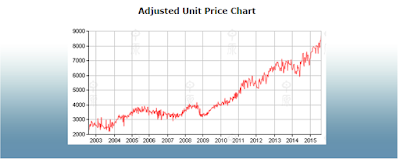
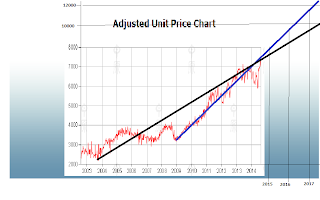
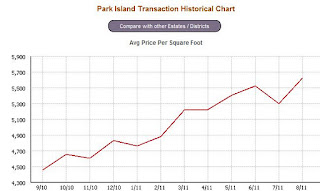
Park Island Property Prices hit fresh highs

Image
Below is the latest Centa City Index price update for Park Island. Park Island Price Graph 2017 Prices now average at $9619.55 psf net, (and over $12500 psf gross). Prices have followed a relatively constant growth trend  since 2009. I spoke to an experienced developer's daughter last month who told me that her family believe average prices will hit over 10K psf net by Chinese new year. (By the way, this also makes it very easy to calculate price. For example a 550 net psf average apartment price would be 5.5m HKD). She expected relatively solid growth of 8% per annum over the next 2-3 years, and indicated that she would only be concerned if overall HK prices spiked up something like 20% in a year, which would in turn lead to a further fear of missing out HK-style frenzy (which would in turn eventually lead to a bubble burst). China values social stability and so would ideally like to see contained but constant, non-volatile growth for HK in a way that keeps the majority

Park Island property prices hit a record high end of August 2015

Image
Park Island property prices hit a new record high end of August 2015. Below is the most recent graph: Park Island Property Prices Hit A New High If you look at the end of the graph, you will see a massive 10.86% jump in prices over the last month. Below are the current average prices (gross PSF and net PSF): The data is taken from   Centadata HK property price data  website (which is the same source I have primarily used in previous updates).  For Park Island property owners who have been agonizing over recent stock market losses, take some comfort that at least your property investment continues to rise in value.

An update on Park Island property prices as we head towards 2016

Image
Let's take a look at how prices of property in Ma Wan / Park Island performed this year so far. A year ago, in August 2014, I made a prediction as to where prices for Hong Kong property might go, in my post:  What will Hong Kong property prices do ? In that post, I wrote the following: "If I had to make a guess I would think that overall, prices will keep rising in 2015 in Hong Kong. I can't see interest rates rising at all until late 2015, and even then they will rise only very very slightly, if at all. Property cooling measures are very unlikely to be increased, and they are more and more being "priced in" which means that eventually, when they are removed, the removal of property cooling measures in Hong Kong will be very supportive of property prices. All in all, the factors going forward, weighed up, point to quite decent property price growth for Hong Kong next year." It turns out I was spot on the mark. I also included a graph at

Park Island Price Graph

Image
Below is a graph showing prices and transaction volumes over the last year which a reader sent me yesterday. I am not sure what the Chinese characters say, but basically the horizontal axis is volume per month, and the vertical axis is the price per square foot. Transaction volumes still look pretty low (lets see how many they have by end of the month), but what is clear is that those who are buying are paying increasingly higher prices. This makes me wonder whether the Government's "cooling measures" have actually been both unfair and counterproductive, as they make sellers less willing to sell, yet genuine buyers are needing to fork out more. What do you think?

Park Island property prices are poised for a new surge

Image
Property agents around Park Island are reporting strong buying demand for Park Island properties as primarily Hong Kong investors appear to see significant gains ahead for Park Island property as a result of end-user demand. Some agents are forecasting a price of $10,000 psf for regular apartments to be reached by early 2014. I think this is possible but more likely by the end of 2014 or early 2015. Below is the most recent price graph for Park Island, just out today, which seems to confirm this trend. Park Island Price Graph At the end of the graph you can see spike of 5.5% rise in prices over the last month. The themes and the factors driving the continued rises are nothing new. Park Island is great value, excellent quality, and still very affordable compared to almost all other parts of Hong Kong. Borrowing costs are very affordable (and seem poised to remain so for some time yet), and Hong Kong residents are increasingly realizing that they need to preserve the value

Park Island price chart for last 2 years

Image
Price Graph for Park Island, Ma Wan, Hong Kong This chart shows prices for Park Island per square foot, from January 2010 to March 2012. As you can see, prices stopped rising for the last 9 months of 2011 (staying at around $5500 psf), and transaction volume fell during the last 6 months of 2011. See this comment on Hong Kong Property Prices I made last year for a more detailed explanation of what lead to the stablizing in prices and the decline in transaction volume in 2011. So far in 2012, it seems prices have started to pick up again, as well as transaction volume, although I am not sure yet if this is a short term effect due to the Anacapri launch or not. Let's see. I still think my predictions in the article referred to above will be correct.

Hong Kong property transactions records - what are the best information sources for current transactions prices?

Image
In the comments section of my blog posting : http://parkislandhongkong.blogspot.com/2011/12/property-prices-on-park-island-hit-new.html  a reader commented: "Where did you get this graph chart from? I want to view the source please, I've looked at Midland, Centadata, gohome and property.hk but they show different results to what you have on this blog." Rather than try to anwer the question in the comments section of that posting, I will try to address it here. The data and the HK property transaction graph were taken from Centaline property: www.hk.centadata.com Specifically for Park Island, see: http://hk.centadata.com/pih09/pih09/estate.aspx?type=3&code=WDPPWPPEPB&lang=eng&source=data I think Centadata is based on results done though the Centaline agency, and it seems to me they update the results daily. So you will see changes in the price graph on a daily basis, depending upon the most recent transactions. That is also where I got the price data for